How to win at League of Legends
Patch 4.21
In a complex game like League of Legends, where each game amounts to the sum total of thousands of strategic and tactical decisions made by ten individuals, it can be hard to decide what to actually focus on. In today's article I am going to look at some common stats to see which ones have the biggest effect on your chance of winning.
Begin.
Here are plots of team-wide total gold earned.
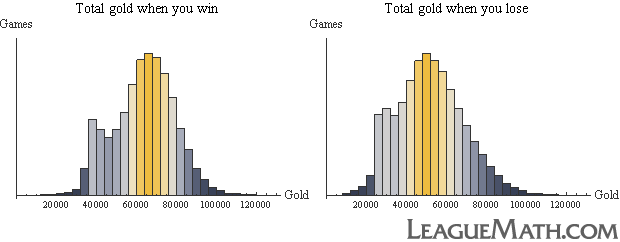
The plot on the left is of gold earned by winning teams and the plot on the right is gold earned by losing teams. They have a similar shape (that of a fairly normal distribution, modulo the bump on the left which is due to the surrender mechanic as discussed in my article on early- and late-game champions.). However, when we look closely, there are subtle differences. The winner histogram peaks somewhat over 60,000 gold, while the loser histogram peaks lower. Getting more gold is correlated with winning; who would have thought?
Interestingly, the loser histogram is less steep. This means that the amount of gold you lose with varies more than the amount of gold you typically win with. This means that once you have a sufficient advantage, it is better to win sooner than later.
These next plots are similar, they are for spent gold.
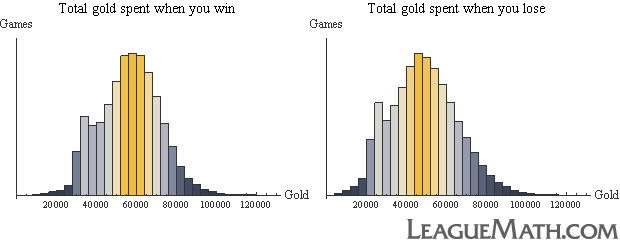
The difference in steepness (standard deviation) between these two is even more pronounced. I think this is to be expected; after all, it is actually spending the gold that affects your in game power, merely earning it is not sufficient. Unspent gold is bad.
Moving on to a more contentious topic, these plots are for wards placed.
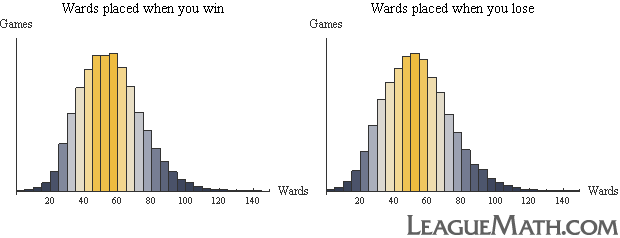
Similar to above, the histogram on the left shows how many wards are placed per game by teams that win, and the plot on the right is how many wards are placed per game by teams that lose.
Just looking at these histograms is, I think, insufficient to draw any real conclusions. There are other summaries of the data we can take (thanks intro stats).
The median number of wards placed by a winning team is 54, and the median number of wards placed by a losing team is 52. Philosophically, I am happy to hear that winning teams place more wards on average, but those two numbers are a lot closer than I thought they would be.
The real difference lies not in the raw number of wards placed, but in the variance in the number of wards placed. The standard deviation of the plot on the left (winners) is only 18.5, while the deviation of the plot on the right is 25.7. To me, this says that it is not simply a matter of more-wards-wins, but that placing just the right number of wards is best. The higher deviation of the plot on the right means that losing teams tend to place either too many or too few wards. Now, that is pretty interesting.
Here are the plots for tower kills.
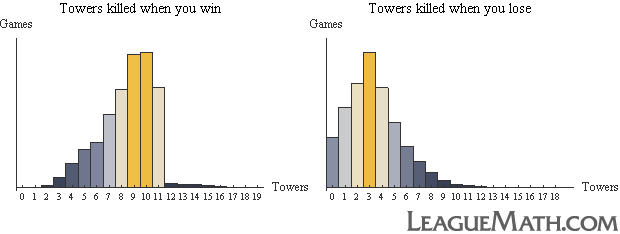
Spoiler alert, taking nine or ten towers correlates well with winning. Probably more interesting than that is the sharp peak at three on the losing histogram. This corresponds to a phenomenon I have noticed both in my games and in professional matches. After taking the outer ring of turrets, a team often struggles to figure out what to do next. Especially with the new shields on the inner turrets, it is significantly harder to press further into the enemy base. To me, this means emphasis should be placed on strategic planning in this particular phase of the game.
Also interesting on these plots is how long the tails are. A few teams have won with only 2 towers taken. The only way that would be possible would be in the event of a surrender. Also, each team only starts with eleven towers, and they don't come back, so how can a team destroy more than 11 towers? This data comes from patches 4.20 and 4.21, both of which have Azir. Apparently destroying his towers counts. Neat.
Comparable to towers in importance are dragons. Here are the plots.
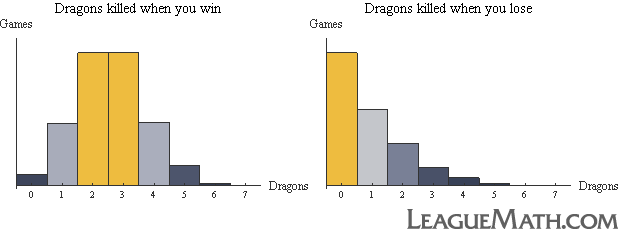
The message here is pretty clear. Don't get shut out on dragons.
I also think it is interesting that two and three dragons are so close, in terms of winning. The third dragon buff (5% movement speed) seems like it should be super-valuable. I wonder how these can be the same.
The falloff between two and three on the losing graph is pretty sharp. It seems at least, that getting three dragons is pretty good insurance against losing.
Finally, here are the plots for Baron Nashor.
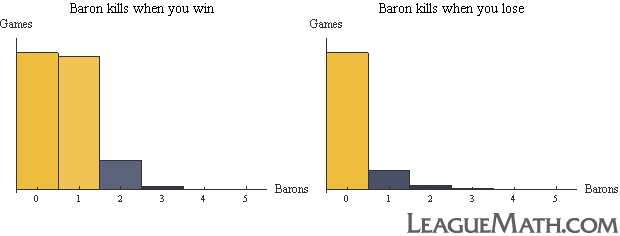
A goodly number of games are won without ever taking a baron. I suppose that is not too surprising. In this dataset more games were won without taking a baron than were won after taking one.
The plot on the right says that a team that does kill baron only very very rarely goes on to lose. That is not super-surprising either. Occasionally a team will over-extend to get the baron, get wiped shortly after taking it, and then lose. So, I think the shape of these plots is fairly predictable.
I want to share a few more stats before we get back to playing.
For each of these that follow I measured the percentage of time that the winning team also took the first objective. A higher number here means taking that objective first has a higher correlation with winning.
First baron winners: 50.06%
Taking the first baron does not improve your chances of winning beyond a coin flip. Wow. Let that sink in, and then think twice before you on-the-way ping baron at 25 minutes.
First blood winners: 59.78%
I have been watching this stat for some time now, and I thought it sounded high. The reward for first blood was increased in preseason 5, so this number would go up. Getting first blood is significantly more correlated with winning than getting the first baron. Be careful out there.
First tower winners: 65.42%
With the relatively reduced benefits of taking towers, it is interesting to see that this number is still higher than that of first blood. I think that players tend to overvalue kills, and undervalue map pressure. It is also a bit surprising to see this number so high given that so many teams stall out after getting three towers. It would be interesting to measure, for instance, what fraction of the time a team takes the first tower, but then goes on to take fewer towers than their opponent.
First dragon winners: 70.69%
Now, that number is pretty high. The first dragon buff (which currently gives 6% bonus ad and ap) is huge. Strategic emphasis must be put on taking the first dragon.
First inhibitor winners: 79.28%
This number is even higher, of course. However, this still means that one in five games are won after being first to lose an inhibitor. One in five is gigantic. One in five is still bigger than the win loss delta of essentially every single player in the long run.
Never give up before you have actually lost!
All right. There are some quick thoughts on win conditions. I hope you find them helpful. I know there were a couple of surprises there that will affect how I think about the game.
In writing this I thought of a few derivative and delta statistics that could be taken here that might be informative as well. Ideas for future articles abound. This first approximation will have to do for now.
Take care, and let me know what you think. Hold your breath and pound F5 until I return with more league nuggets and math nuggets here at LeagueMath.com.
No histogram alignment parameters were harmed in the making of this article.
Peace.