Match duration analysis
Patch 5.6
tl;dr When we are at our best, we play shorter games
Have you ever wondered how much average match length varies with league, day of the week, or time of day? Well... I did. And I happen to have a semi-decent dataset for answering precisely those questions.
In this analysis I looked at 623,281 ranked NA solo-queue matches from patches 5.1-5.6. The database grows, and the insights grow.
Before I did this analysis, it was my prediction that game-length wouldn't vary significantly across these factors. Ultimately, this prediction was correct, but the small variances that I did find I thought were interesting enough to share (even if they may not have earth-shattering statistical significance).
Here is a chart of match length per league:
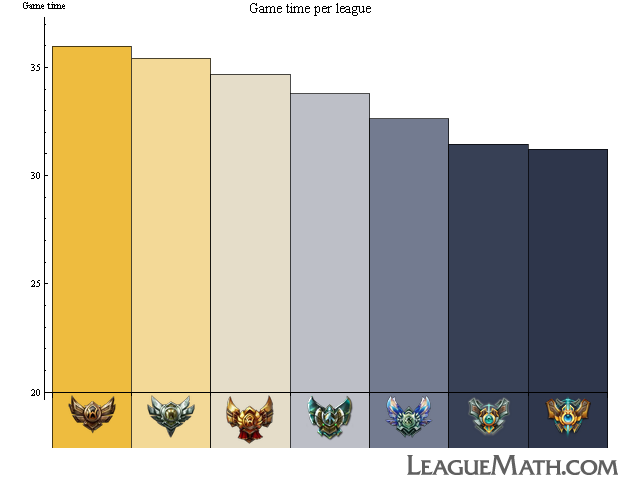
Note that the bottom of these charts is 20 mins, not zero, which has the effect of making the difference look more dramatic than it is.
Though the difference is not super-dramatic, there is a monotonic downward trend in average game length as players climb in skill. One hypothesis here is that more games end in surrender at higher elo (MMR). Sadly, there is no efficient and foolproof way to determine this from the data in the current Riot API.
More likely, my guess, is that better players know how to close games out earlier. Winning League of Legends is often about pressing marginal advantages. Better players are going to know when they have an advantage, and what to do with it to win the game as soon as possible.
Here is the data used to produce that chart, for the stats people I know are reading this:
| League | Game Time | Deviation | Games |
|---|---|---|---|
Bronze | 35:59 | 8:32 | 84676 |
Silver | 35:25 | 8:15 | 108801 |
Gold | 34:40 | 8:03 | 93294 |
Platinum | 33:47 | 7:56 | 150748 |
Diamond | 32:37 | 7:53 | 170729 |
Master | 31:27 | 7:49 | 9687 |
Challenger | 31:12 | 7:41 | 5346 |
The game time is dropping, and so is the standard deviation of each sample. Games at higher elo (MMR) have a more predictable shape. Remember, these variations are quite small, so all of this must be taken with a grain of salt; but I believe this data is both explicable and interesting. So, I share it with you.
The variation in the number of games/league comes from my data acquisition techniques. My system is always searching the top of the ladder for games played by the very highest ranked players. The fact of the matter is that most top-tier games have the median player ranked in Diamond. So, I will find disproportionately many Diamond league games. I run separate searches to find lower-ranked games to keep the numbers approximately even.
Here is a chart of match lengths per day of the week:
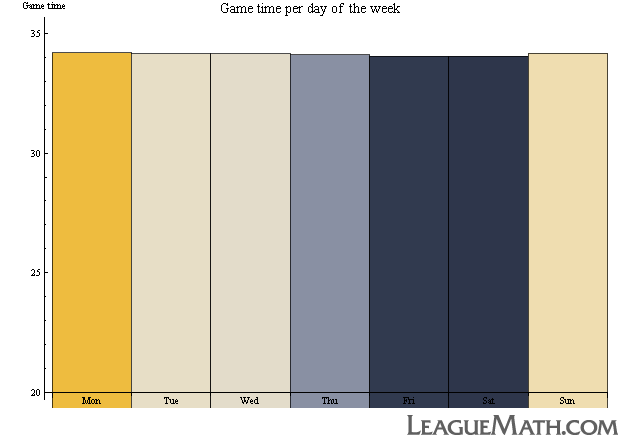
That is pretty flat. It would be weird to see big swings here, I think. Here is the data for this chart, in case you are interested.
| Day | Game Time | Deviation | Games |
|---|---|---|---|
| Monday | 34:12 | 8:09 | 83341 |
| Tuesday | 34:10 | 8:09 | 80258 |
| Wednesday | 34:09 | 8:09 | 80388 |
| Thursday | 34:06 | 8:12 | 89033 |
| Friday | 34:03 | 8:10 | 97792 |
| Saturday | 34:03 | 8:10 | 103538 |
| Sunday | 34:10 | 8:12 | 88931 |
Super flat.
The variation in the games/day of the week is notable, but probably not for the reason you would expect. I do not have any actual data on how many games are played each day, and sadly my data acquisition techniques (which are essentially the path of least resistance on the excellent Riot data API) have too many uncontrollable factors to say these numbers represent anything like the actual ratio of games played per day of the week.
What is more likely here is that we are seeing the fact that I do my heaviest data collection on Fridays and Saturdays. Still neat to see, though. I would be super-interested to know the actual ratio.
Here is a slightly different chart. This time, match length per hour-of-the-day:
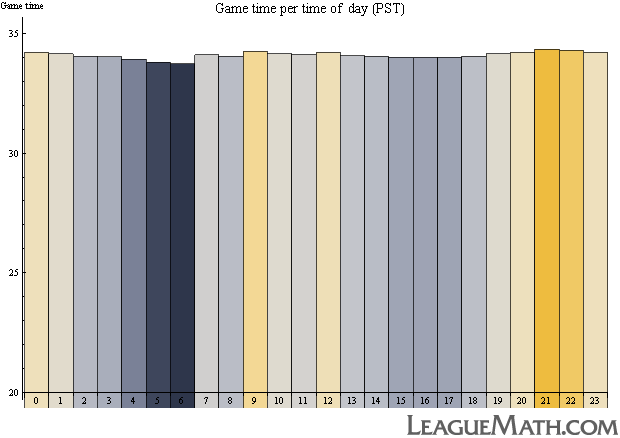
The hours run along the bottom; 0 is midnight, 6 is 6 AM, 12 is noon, 22 is 10 PM, etc... Note that these times are starting times for games in the PST timezone. I live in Mountain Time, so these numbers are all one less for me.
Again, very flat. But it is fun to read ideas into the data where there probably actually are not any. Are the people playing at 6 AM taking the game more seriously? Are the games we start at noon or 9 or 10 PM marginally sloppier?
Here is the table for that chart:
| Hour | Game Time | Deviation | Games |
|---|---|---|---|
| 0 | 34:13 | 8:09 | 34618 |
| 1 | 34:09 | 8:11 | 28435 |
| 2 | 34:03 | 8:12 | 22465 |
| 3 | 34:01 | 8:17 | 16221 |
| 4 | 33:56 | 8:15 | 12015 |
| 5 | 33:47 | 8:17 | 9457 |
| 6 | 33:44 | 8:18 | 8667 |
| 7 | 34:06 | 8:18 | 8872 |
| 8 | 34:03 | 8:14 | 10336 |
| 9 | 34:16 | 8:22 | 13014 |
| 10 | 34:09 | 8:15 | 16358 |
| 11 | 34:07 | 8:16 | 19909 |
| 12 | 34:13 | 8:10 | 23419 |
| 13 | 34:04 | 8:08 | 26817 |
| 14 | 34:03 | 8:10 | 30169 |
| 15 | 34:00 | 8:10 | 32793 |
| 16 | 34:00 | 8:05 | 34768 |
| 17 | 34:00 | 8:08 | 36330 |
| 18 | 34:03 | 8:08 | 38356 |
| 19 | 34:09 | 8:03 | 39531 |
| 20 | 34:12 | 8:09 | 40121 |
| 21 | 34:20 | 8:12 | 41215 |
| 22 | 34:18 | 8:08 | 41023 |
| 23 | 34:12 | 8:12 | 38372 |
Again, it is tempting to look at the distribution of games/time-of-day and try to say something. Where the numbers are lower, I would expect to see fewer games played. But again, the data acquisition techniques do not have any provision for trying to sample games evenly (the strategy is a graph-walk from games to their players to their games) so these numbers are more than likely not representative.
As ever, do with them what you will.
This post is done, and it is unbelievably gorgeous outside. So we are done here. I am honored that you take the time to read these articles and you make it to the bottom every time. You're the best.
I do not know if we learned a lot today. It is interesting to see player skill quantified in the first chart, even if the differences are not that dramatic. We should all be working to recognize our advantages and to press them to victory. I invite you to tweet me if you have any thoughts on this or past or future articles.
Now go outside! Or if you don't want to, go back to the index and find another post to read. Regardless, get on the rss feed if you want to know within seconds of the next post going up.
See you in a week for some more league'd-up math here at LeagueMath.com.
No 6 AM lp grinders were harmed in the making of this article.
Peace.